The PrestaShop addon GTmetrix speed test API integration helps to do daily speed analysis of the website. It is to configure and helps to know PageSpeed Score, YSlow Score, Fully Loaded Time, Total Page Size, Requests,html_bytes,page_elements,report_url,html_load_time,page_bytes, and many more statistics information same as the Gtmetix website inside back-office.
GTmetrix is an online speed testing tool that allows webmasters to test their site loading times, to arrive at a fully loaded time, as well as a “score” from both Google PageSpeed and Yslow tools in one “hit”.
GTmetrix as well as Pingdom’s Full Page Test, are therefore useful tools in a web optimizer’s archive, not least because the GTmetrix speed test results are stored (for a while) and can be referred back to later, to compare future speed improvements against.
This tool, therefore, provides a nice objective measure for web-optimizers to run tests.
Speed is very important for SEO and if your website speed is very slow, users may quit your website and the bounce rate will be increased. So you have to think about How To Improve Your Website Speed. There are many free tools available in the market to check your website speed. GTMetrix is one of the tools used to get detailed reports about a website’s performance. Of course, it uses a combination of Google PageSpeed Insights and YSlow to generate scores and recommendations, therefore your results should be precise.
GTmetrix is a tool to test the speed website, thereby measuring website performance according to many different scores. This is a popular and reliable tool used by many people today.
GTmetrix’s feature-rich system will help you evaluate your website based on your scores. Accompanying it are suggestions of solutions for you to improve the speed and upgrade the website.
GTmetrix versions include both free and paid versions. You can experience the basic features in the free version of GTmetrix before upgrading to the paid version to use more features. Monitoring, managing, and increasing the performance of the website will become fast and convenient.
GTmetrix is a tool for customers to easily test the performance of their web pages.GTMetrix is a tool that analyzes page speed and performance. It generates scores for our pages and offers Pagespeed and Winslow. It is a free tool that we have found to be used to get detailed reports about site performance. It creates scores for the pages and also provides recommendations to fix them
This tool is really helpful in SEO and also for developers. You can get an idea of what is wrong with the website and easily improve the website with the help of GTMatrix. It goes into great detail as it checks both Google PageSpeed and YSlow metrics, assigning your site a grade from F to A. GTMatrix’s reports are divided into five different sections including PageSpeed, YSlow, waterfall breakdown, video, and history. A good PageSpeed or YSlow score means that your page is optimized for the browser to render as fast as possible. However, the scores it gives are not 100% accurate. Your internet connection can be bad at present or with a lot of visitors visiting your website – the tool will give you a lower score than usual.
Website visitors are only interested in their experience on the website. If the client has to wait too long to see the content and layout on the page, they will exit. An increasing bounce rate is a sign that your website is not performing effectively.
Paying attention to the website scores on GTmetrix is a method of increasing customer experience on the page.
Your high score shows that your website is doing very well. If your score is low, you should optimize your website by discarding some large files, installing website speed optimization extensions, or using website speed optimization services. Software and services to optimize website speed will help the website operate much better without wasting time and effort.
In some cases, the website score on GTmetrix is low, but the website still loads fast. Don’t worry! This is because the scores are calculated mostly based on the front end. There will be backend factors that affect the speed of your website like hosting and scaling features.
Recently, GTmetrix has updated some more professional and effective changes.
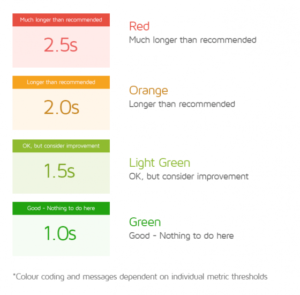
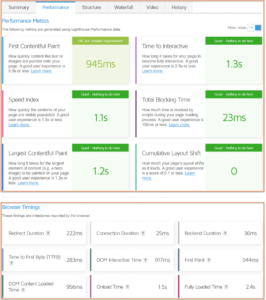
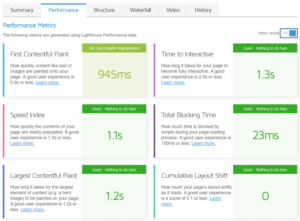
First Contentful Paint – gives an indication of the speed with which images and text are painted onto your page. 0.9s or less is a good score. If we want detailed test results and track them over time, you should go ahead with GTmetrix. For actionable insights that affect SEO directly, you should use Google’s PageSpeed Insights. Speed Index (SI) is a performance metric that measures how quickly your page is visually complete above-the-fold.GTmetrix is accurate, but the results and testing may be different from what you or your clients are used to. GTmetrix testing is done with a real browser to load websites with an unthrottled connection (no usage thresholds) by default. The wait time in GTmetrix is actually referring to the time to the first byte, also known as the TTFB in some tools. TTFB is a measurement used as an indication of the responsiveness of a web server or other network resource. Generally, anything under 100 ms is acceptable and good TTFB
With this addition of technology, the new GTmetrix Report has been completely redesigned to incorporate the Lighthouse data and metrics.
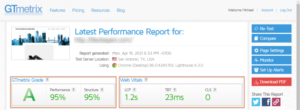
GTmetrix also came up with a new scoring system, which includes the new GTmetrix Grade, alongside the new Performance and Structure Scores. With the new GTmetrix report, you can learn more about the performance of your site through new tabs, visualizations, graphs, and deeper insights.
GTmetrix tool allows users to easily learn how quickly their site is or isn’t performing, where it’s doing well, and where it’s not doing so hot. GTmetrix has earned a reputation of being the most popular benchmarking tool on the Internet to date
GTmetrix is known for being easy to use and understand, which makes it great for newbies and experienced developers alike. GTmetrix is trusted by companies such as BMW, HPE, Hasbro, Bayer Pharmaceuticals, T-Mobile, Nordstrom, Thomson Reuters, and more. If it’s good enough for them
Lighthouse is a tool developed by Google to analyze web apps or web pages and collect modern performance metrics and insights to help developers tune their website or web app for the best performance possible. You can run Lighthouse against any web page, whether it’s public or one which requires authentication. It has audits for performance, accessibility, progressive web apps, and more.
GTmetrix offers its service in two forms, free accounts, and premium accounts. The key differences in the paid accounts are you get access to the premium test locations and you can run more tests per week.
With a free GTmetrix account, you get access to servers in the following free test locations:
San Antonio, Texas, USA
Vancouver, Canada
São Paulo, Brazil
London, United Kingdom
Mumbai, India
Hong Kong
Sydney, NSW, Australia
With a paid account, you have access to the above locations, but also the premium servers listed below:
San Francisco, California, USA
Cheyenne, Wyoming, USA
Chicago, Illinois, USA
Danville, Virginia, USA
Quebec City, Quebec, Canada
Stockholm, Sweden
Amsterdam, The Netherlands
Frankfurt, Germany
Paris, France
Dubai, United Arab Emirates
Johannesburg, South Africa
Chennai, India
Busan, South Korea
Tokyo, Japan
The Performance Score is made up of 6 key metrics with the following weights:
Loading performance, which makes up 55% of this part of the score. This score breaks down as follows:
First Contentful Paint – 15%. This metric measures how quickly visitors can view actual content on your site, like text, images, and video.
Speed Index – 15%. This metric measures how quickly your page is visually complete above the fold.
Largest Contentful Paint – 25%. This is a performance metric introduced in 2020 by Lighthouse to better measure the perceived loading experience for users. This is also one of the metrics making up Google’s Web Vitals, for reference.
Interactivity makes up 40% of the part of this score. This score breaks down as follows:
Time to Interactive – 15%. This is a performance metric that measures a page’s load responsiveness and helps identify situations where a page looks like it’s an interactive page, but it actually isn’t.
Total Blocking Time – 25%. This is a performance metric from Lighthouse introduced in 2020 which measures the total amount of time your webpage was blocked from user input. This is also one of the metrics making up Google’s Web Vitals, for reference.
Visual Stability, which makes up 5% of the part of this score. This score breaks down as follows:
Cumulative Layout Shift – 5%. This is a performance metric introduced in 2020 from Lighthouse which measures the perceived visual stability of a page load, i.e. unexpected shifting of web elements on the page as it loads. This is also one of the metrics making up Google’s Web Vitals, for reference.
Each of these metrics is measured + calculated as a score, then compared to a threshold, and the aggregate result, with appropriate weighting, makes up the final Performance Score. The findings of the Performance Score are available in the Performance Tab of the GTmetrix report.
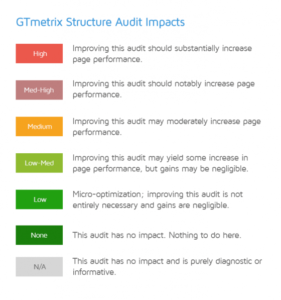
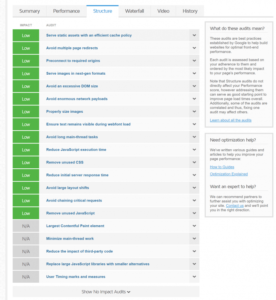
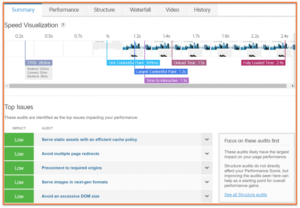
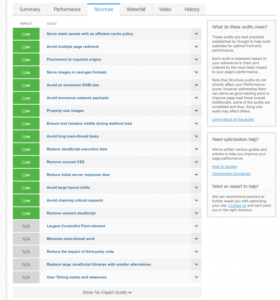
This tab is new to GTmetrix Reports and shows you a complete snapshot of the performance, structure, and load behavior. You should consider any issues which appear here to be action items. The information alone in this section can provide significant guidance in improving your page’s performance
This version of GTmetrix is the most comprehensive yet to hit the Web and has been completely redesigned to integrate the new data from Lighthouse testing, which will most likely change the entire way you assessed the performance of your site.
Google established Web Vitals as the core metrics you should focus on when attempting to deliver a fast website/web app experience.
The Web Vital metrics include the following:
Largest Contentful Paint (LCP) – this measures how long it took your largest content element to display.
Total Blocking Time (TBT) – this measures how much time was blocked by scripts during the page load.
Cumulative Layout Shift (CLS) – this measures how many layouts shift the user experienced when they loaded your website/web app.
If you’re doing well on these metrics, it’s a pretty good indicator that you’re delivering a fast and what Google calls a “delightful experience” to your visitors.
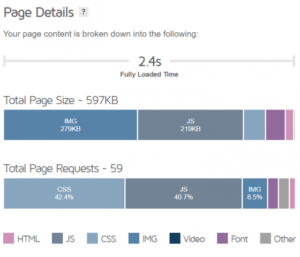
The page details are the most important and immediate info you can have on your website performance:
Fully Loaded Time
The length of time required for your page to become interactive in the test browser is expressed in seconds.
Total Page Size
The total amount of data downloaded to the test server, in MB, including all media assets such as images.
Requests
This is the number of individual HTTP requests generated by your site via scripts, CSS, etc.
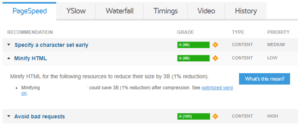
Pagespeed shows the most basic information and the lowest-hanging fruit for making your site load faster. Recommendations are ranked with a grade, using a lettering system, where A to F (best to poor). Under the Type columns, it shows what sort of content or area the recommendations refer to(Content, Server, js, etc.), and in the last column, Priority, it gives an indication of the individual issue’s importance in the overall result(High, Low and Medium).
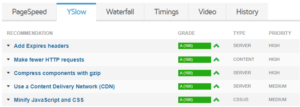
YSlow
YSlow is the next category of results. Similar to the previous tab (page speed) YSlow test represents the key areas why your website is slow. This tab offers suggestions for enhancing your page’s performance and provides you with detailed statistics related to the page in addition to summarizing the various page components.
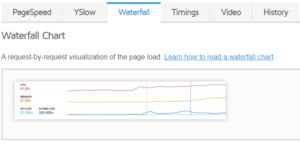
Waterfall
This is a chart of every single request made by your site, including media files, JavaScript, CSS, etc. It displays the request-by-request loading behavior of your website. Every script, media file, and/or third-party resource your page requests are displayed here.
Timings
The timings tab displays some advanced results, these events include:
Redirect duration
Connect duration
Backend duration
Time to First Byte (TTFB)
First paint time
DOM interactive time
DOM content loaded time (and JavaScript event duration)
Onload time (and JavaScript event duration)
RUM Speed Index
GTmatrix’s unique timeline visualization gives you the event occurrences in order so you can see at a glance where they happen. Events are in order, however, they are not to scale. This is due to web pages potentially having massive or negligible differences between events.
The GTmatrix History tab contains all of the graphs that were previously under the “Performance History” tab, also added tooltips to the nodes that allow you to:
View the highlighted report (if you’re not already viewing it)
Compare the highlighted report to the currently viewed report
Delete the highlighted report
This provides our users with a more visual way of keeping track of past reports.
It is a free tool that analyzes your page’s speed performance using Google Page Speed and YSlow.
Yes, It is a good website speed test tool. analyzes your site to see if your website’s front end is following best practices – You get PageSpeed/YSlow grades based on your page’s adherence to the rulesets. A good PageSpeed/YSlow score means that your page is optimized for the browser to render as fast as possible.
GTmetrix is a performance testing tool for websites to display various statistics like page load time, page speed scores, recommendations on where you may improve your site speed, etc.
GTmetrix is a website speed-checking tool that gives a complete analysis of your website and issues.
By resolving those issues you can increase the speed of the website.
It scans a website thoroughly
People rely on GTmetrix more than Google results for your website scans and their speed.
Features
– The entire module can be managed through the back -office.
– SEO friendly.
– Flexibility and ease of use.
– Easy to install and use. Quick Integration.
– Fully responsive 100%.
– Lightweight. (Smaller file size which loads faster.)
– SEO friendly.
– Support all browsers: Firefox, Chrome, IE, Safari, etc.
– Lightweight. (Smaller file size which loads faster.)
– Increase sales, conversion rates, and product promotions.
– Maintain existing customers & Attract new customers.
– Lower marketing expenses, exposure to potential customers, and reach targeted audiences.
– Support multiple browsers and operating systems.
– Helps to find targeted audience visits and conversions in sales.
– Help in analysis, statistics, SEO, and marketing campaigns.
– Alternate option instead of using analytics script from Google Analytics and Statcounter.
– SEO friendly.
– Support all browsers: Firefox, Chrome, IE, Safari, etc.
– Lightweight. (Smaller file size which loads faster.)
– Compatible with PrestaShop 1.5.x,1.6.x,1.7.x and 8.0.
– Multiple browser compatibility(IE, Firefox, Opera, Safari, Chrome, and Edge).
– Mobile, Tablet, and all devices compatible.
– Multi-language and Multi Store compatible.
– 24*7 Support
– Good Documentation
Installation :
Step 1: Upload the module zip file from the back-office Module & Services menu tab. Module Manager area using the upload button. After the successful installation module menu, the link will appear in the left menu or top menu in the back-office more area.
Step 2: Install the module using the install button.
Step 3: Visit the module management page from the back-office “More” area (section) in the left menu in the back office.
Step 4: The module installation process is very easy, how module configuration works can be seen in the demo instance.
Step 5: Please visit our demo instance for module configuration and usage demo.
Step 6: Please watch our YouTube channel for demo videos on the module, and how to use and configure it on the website.
– Module works without making any change in the existing PrestaShop file so that existing customization and theme change do not affect.
– We provide free technical and feature support in installation, configuration, and access to updates available for this product.
– Free support on installation, configuration, and customization as per store requirements, for example, new hook addition to your store.
Other :
Please leave your valuable feedback after using the module.
This will help to increase self-confidence, improve service, and enhance the module as per requirements to make it better for different online stores.
For a demo on version 1.7.x visit the below links
Front-office Demo URL => https://www.hrms-systems.com/presta-addons/en/
Back-office Demo URL => https://www.hrms-systems.com/presta-addons/admin619j6kpbb/index.php
For a demo on version 1.6.x visit the below links
Front-office Demo URL => https://www.hrms-systems.com/presta-apps/en/
Back-office Demo URL => https://www.hrms-systems.com/presta-apps/admin539fyipwq/index.php
OUR PRESTASHOP ADDONS MARKETPLACE URL
PrestaShop Marketplace URL => https://addons.prestashop.com/en/2_community-developer?contributor=301729
Alternate module download URL => https://www.presta-addons-modules.com
